Opinion
Analysis of the data so far on this year’s results from A Levels and other qualifications by our Head of Research & Policy, Rebecca Montacute.
This year’s results are a major milestone for this year group, after years of disruption throughout key parts of their education due to the pandemic, followed quickly by the cost of living crisis – with the lowest income young people hardest hit.
Perhaps unsurprisingly, given the huge challenges this cohort has faced, initial data show some worrying trends for educational inequality, with potential long-term implications for social mobility.
A level results
This year, Ofqual were aiming for a return to pre-pandemic grading standards, with a large fall in top grades expected.
And indeed, overall, the proportion of top A level grades (A and A*) has fallen again this year, from 36.4% in 2022 to 27.2% in 2023, a fall of 9.2 percentage points. This is, however, still higher than pre-pandemic, with the same figure standing at 25.4% in 2019. And lower grades have actually fallen further than those at the top, with overall grades of E and above now slightly below where they were in 2019, at 97.3%, compared to 97.6% pre-pandemic.
Educational inequalities
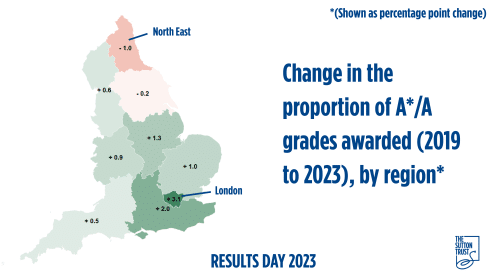
Concerningly, regional gaps within England have widened. The proportion of students gaining A and above has fallen the most in the North East (down from 23% to 22%, a fall since 2019 of 1 percentage point, or pp for short), and has also fallen slightly in Yorkshire and the Humber (down -0.2pp from 23.2% to 23%).
Conversely, rates of top grades have actually increased in several regions compared to pre-pandemic, including London, where it’s gone up from 26.9% to 30%, an increase of 3.1pp, and in the South East, where it’s gone up from 28.3% to 30.3%, and increase of 2pp.
These regional gaps represent a widening of existing inequalities, with London often taking the top spots for grades, and the North East frequently seeing the lowest results. Regional inequalities reflect a mix of factors, from patterns of deprivation across the country, to population demographics, through to the quality of schools in an area. We know that disadvantaged young people have been more heavily affected by the pandemic, as well as bearing the cost of the ongoing cost of living crisis. All of these factors will play a part in these regional differences.
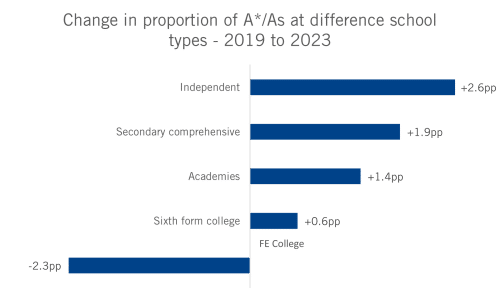
The gap between state and private schools has also widened since 2019, A*/A grades at independent schools are up by almost 3 percentage points (2.6) to 47.4%, while at comprehensives the increase was 1.9 percentage points (up to 22%), and at academies only 1.4 percentage points (up to 25.4%)
We also don’t yet have data to compare the performance of students eligible for free school meals to their more advantaged peers, but this will be important additional context to this year’s results when it’s released later in the year. Last year, the A-level disadvantage gap was at its widest since records began, and signs from the data so far do not appear to signal we’re likely to see a reversal of that trend.
University access
This year, 230,600 18-year olds have been accepted to university across England, Scotland, Wales and Northern Ireland.
This is a slight decrease on the figure for 2022 (238,090), but an increase on numbers pre-pandemic.
The 18 year old entry rate in England has fallen from 32.5% to 30.6%, from a high of 34.7% in 2021. But it is still higher than the pre-pandemic rate of 28.5% in 2019.
Last year, after several years of expansion, acceptances at higher tariff universities fell. The share of acceptances at higher tariff universities stayed at a similar level this year (40.1% of 18 year old acceptances vs 39.98% in 2022), with slightly lower numbers of students accepted (101,560 18 year olds this year, compared to 104,430 in 2022, and a lower level of 86,420 in 2019).
Widening participation
The story on university access this year is a little more complicated, underlining the importance of fully understanding the measures you’re using to look at access and disadvantage.
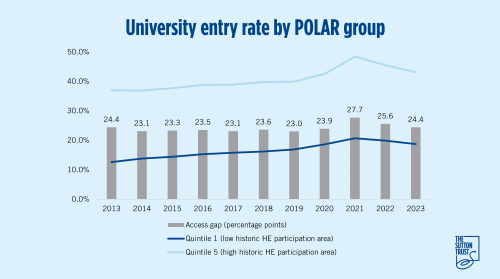
First, looking at POLAR (Participation of Local Areas – which looks at historic rates of participation in higher education in an area), the gap in participation between the most under-represented areas and the least has closed slightly since last year, currently at 24.4pp, having fallen from 25.6pp in 2022.
However, the gap is still higher than it was back in 2019 (23pp) and is the highest it has been since 2013. To see essentially no progress in closing the gap on this measure in the last decade is certainly depressing. However, entry rates in all POLAR groups (alongside overall entry rates) are down this year, and it is positive that this fall has at least not come at the cost of widening this access gap.
POLAR is a useful measure at a national level to look at how well barriers across the country to HE participation are being broken down, and can help to get at attitudes and expectations around university in a local area, but it does not directly relate very well to incomes.
Data was also released looking at IMD (short for Indices of Deprivation), looking at relative deprivation at area level, which is a much better measure to look at how income is impacting on university access. Looking at this measure, there has been better progress. The gap between the most and least advantaged IMD groups has, unlike POLAR, returned to its pre-pandemic levels, falling from a high of 25pp in 2021, and 23pp in 2022, back down to 22pp in 2023.
Pre-pandemic, the same figure was 21pp in 2019, and 22pp every year from 2014 to 2018. However, while it is promising the gap here has not widened, that also means there has been no progress on narrowing the gap by this measure since 2014.
How can we tackle these issues going forward?
The disruption of the pandemic has had a major impact on young people’s learning, issues that won’t end with this year group. And even before the pandemic, there had been long-standing inequalities between students from lower and higher incomes, from different regions, and who attended difference types of schools.
We urgently need a national strategy to tackle these inequalities and close the attainment gap in schools. A key part of this is a long-term plan for the National Tutoring Programme, an evidenced backed intervention which has huge potential to help narrow the attainment gap. Alongside this, there should also be additional support for less advantaged students post-16, by expanding the pupil premium to this age group. Disadvantage doesn’t stop at age 16, so the associated funding shouldn’t stop either.
And both universities and employers will need to step up to give support to this year’s cohort, to take into account the impact the pandemic has had on their learning and development, and to help them as they progress through education and into the workplace.
Young people should rightly be proud of their achievements, but these inequalities show that too many did not have a fair chance to fulfil their potential. We must do better, and give every student an equal chance at success.


