News
Commenting on today’s KS4 stats, Carl Cullinane, Director of Research and Policy at the Sutton Trust, said:
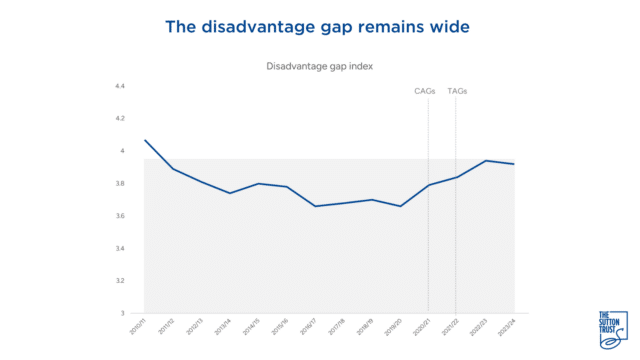
‘It’s appalling to see the attainment gap between disadvantaged pupils and their better-off peers remains wide. This gap had already been at its widest point since 2011, meaning an entire decade was lost for improving the life changes of young people from low-income households. This amounts to nothing less than a ticking time bomb for equality of opportunity and social mobility.
‘The Government has said little about its plans to close the attainment gap. We need to see a clear national strategy for tackling this issue. Since 2017, school funding has been too heavily weighted towards better-off areas. This must be reversed so schools with the highest needs receive the funding they require. Pupil premium money for disadvantaged pupils also needs to be boosted, so schools can pay for evidence-based programmes like tutoring for their poorest pupils. And reform to school admissions is urgently needed to ensure good schools are more inclusive of their local communities.’
Summary:
- The headline disadvantage gap index, showing the differences between disadvantaged pupils and non-disadvantaged pupils, is largely stable, at 3.92, compared to 3.94 in 2022/23. It remains historically high, and was 3.66 in 2017.
- The attainment gap has slightly widened in terms of Attainment 8 when comparing to both 2018/19 exam data and 2022/23 data. For the percentage achieving grades 5 and above in English and maths, the gap has slightly widened since 2018/19, and 2022/23.
- The average Attainment 8 gap has widened from 13.6 points in 2018/19 to 15.3 points in 2022/23 and to 15.5 in 2023/24. The widening was caused by the disadvantaged group having a larger decrease than the non-disadvantaged group.
- The percentage of pupils achieving grades 5 or above in English and mathematics GCSEs – 25.8% for disadvantaged compared to 53.1% non-disadvantaged.
- Progress 8 scores for disadvantaged and non-disadvantaged pupils showed that non-disadvantaged pupils averaged a Progress 8 score of 0.16 whereas disadvantaged pupils averaged a Progress 8 score of -0.57. Last year, this was 0.17 and -0.57 respectively. This means non-disadvantaged pupils, on average, progressed more than expected when compared to pupils in their prior attainment group, whereas disadvantaged pupils achieved over half a grade less than expected by the end of KS4. In 2019, this gap was significantly lower: 0.13 compared to -0.45.
